
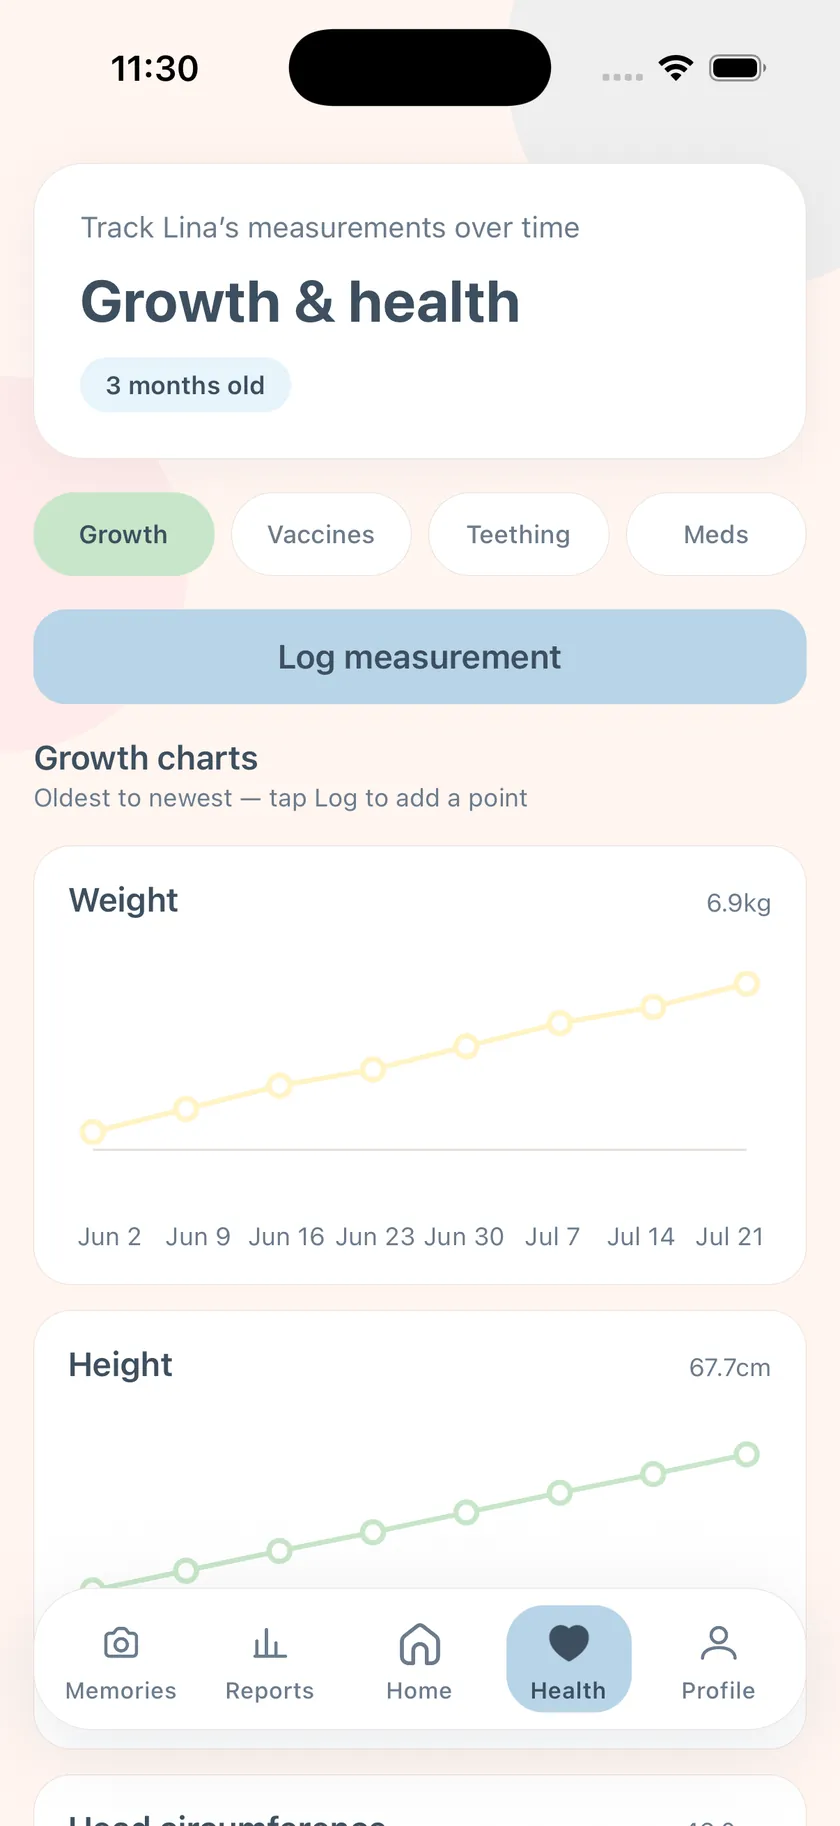
What the growth chart shows
Health → Growth lists your logged measurements, oldest to newest, as a line chart per measure. Each check-up adds a point. The most recent value sits beside the chart title — 6.9 kg, 67.7 cm — so the current number is a glance away.
This is a growth record, not a growth calculator. EasyPeasyBaby does not overlay WHO or CDC percentile curves and does not tell you whether a number is “normal”. Interpretation belongs to your pediatrician; the app makes sure you arrive with the history.
- Weight, height, head circumference, and temperature
- One line chart per measurement
- Latest value shown beside each chart
- Shared with a co-parent on Family Premium
Logging a measurement
Open Health, keep the Growth chip selected, and tap Log measurement. Choose the measure, enter the value, and save. Doing it in the waiting room means the point is on the chart before you have left the clinic.
Growth next to everything else
The same Health tab keeps the vaccine checklist for your country schedule, the teething chart, and the medication log, and the rest of the app holds feeds, sleep, and diapers. When a doctor asks about feeding alongside weight, both are in the same app.
For the milestones that are not numbers
Growth is also first smiles and first steps. The Memories tab keeps a photo timeline of milestones — first smile, first step, first word, first tooth, or anything custom — with a date and note.
Not medical advice
Growth patterns vary widely and only a professional who examines your baby can assess them. Use the charts to remember and to share, not to self-diagnose.
Frequently asked questions
Does the app calculate growth percentiles?
No. It charts your logged values over time without percentile curves.
How often should I log growth?
Whenever you have a new measurement — usually after a check-up. The app does not prompt for measurements.
Can my partner see the charts?
Yes. On Family Premium both parents see the same Health tab.
Are growth charts free?
Yes. Growth charts are part of the free-forever core.
EasyPeasyBaby is a care log for parents, not a medical device. Wake windows, reminder intervals, and reports are general conveniences based on what you log — not medical advice. Talk to your pediatrician about your baby’s feeding, sleep, and growth.